
| 1. Raise Your Share Price The share prices of companies that invest in design performed up to three times better than the FTSE 100 Index over nearly two years in the run-up to December 2004, according to new data released by the UK’s Design Council. View the report. 2. Save Money According to a report from Forrester Research, the poor usability of applications may be costing organizations as much as $6 million annually in hidden costs and lost productivity. “Savings from earlier vs. later changes: Changes cost less when made earlier in the development life cycle. Twenty changes in a project, at 32 hours per change and [a minimal] hourly rate of $35, would cost $22,400. Reducing this to 8 hours per change would reduce the cost to $5,600. Savings = $16,800.” (Human Factors International, 2001) “A financial services company had to scrap an application it had developed, when, shortly before implementation, developers doing a User Acceptance test found a fatal flaw in their assumptions about how data would be entered. By this time, it was too late to change the underlying structure, and the application never implemented.” (Dray, 1995) Detect Problems Early And Save Big “[Usability engineering techniques] are quite effective at detecting usability problems early in the development cycle, when they are easiest and least costly to fix. By correcting usability problems in the design phase, American Airlines reduced the cost of those fixes by 60-90%.” (Bias & Mayhew, 1994) “One [well-known] study found that 80 percent of software life-cycle costs occur during the maintenance phase. Most maintenance costs are associated with “unmet or unforeseen” user requirements and other usability problems.” (Pressman, 1992) “Incorporating ease of use into your products actually saves money. Reports have shown it is far more economical to consider user needs in the early stages of design, than it is to solve them later. For example, in Software Engineering: A Practitioner’s Approach, author Robert Pressman shows that for every dollar spent to resolve a problem during product design, $10 would be spent on the same problem during development, and multiply to $100 or more if the problem had to be solved after the product’s release.” (IBM, 2001) 3. Free Your Resources From Fixing Defects “Martin and McClure found that $20-30 billion was spent worldwide on maintenance. Studying backlogs of maintenance work shows that an “invisible” backlog is 167% the size of the declared backlog. Anonymous case study data show that internal development organizations are spending the majority of their resources on maintenance activities and thus cannot initiate development of strategic new systems.” (Martin & McClure, 1983) 4. Cost-Benefit Ratio of $1:$100 “The rule of thumb in many usability-aware organizations is that the cost-benefit ratio for usability is $1:$10-$100. Once a system is in development, correcting a problem costs 10 times as much as fixing the same problem in design. If the system has been released, it costs 100 times as much relative to fixing in design.” (Gilb, 1988) “Sun Microsystems has shown how spending about $20,000 could yield a savings of $152 million dollars. Each and every dollar invested could return $7,500 in savings.” (Rhodes, 2000)Reduce Training Costs “At one company, end-user training for a usability-engineered internal system was one hour compared to a full week of training for a similar system that had no usability work. Usability engineering allowed another company to eliminate training and save $140,000. As a result of usability improvements at AT&T, the company saved $2,500,000 in training expenses.” (Bias & Mayhew, 1994) | 5. Improve Efficiency up to 50% by Fixing Minor Flaws “The average UI has some 40 flaws. Correcting the easiest 20 of these yields an average improvement in usability of 50%. The big win, however, occurs when usability is factored in from the beginning. This can yield efficiency improvements of over 700%.” (Landauer, 1995) 6. Raise User Satisfaction by 40% “When systems match user needs, satisfaction often improves dramatically. In a 1992 Gartner Group study, usability methods raised user satisfaction ratings for a system by 40%.” (Bias & Mayhew, 1994) 7. Reduce Liability, Employee Absenteeism and Turnover “Humantech, Inc., studied ergonomic office environments and productivity for 4000 managerial, technical, and clerical workers in a broad cross-section of North American industries. Surveys showed that video display terminal workers had twice as many complaints of neck and shoulder discomfort, eye strain was reported three times as often, and there were higher rates of absenteeism less job satisfaction, and increased (30%) turnover.” (Schneider, 1985) 8. Reduce Support Calls “A certain printer manufacturer released a printer driver that many users had difficulty installing. Over 50,000 users called support for assistance, at a cost to the company of nearly $500,000 a month. To correct the situation, the manufacturer sent out letters of apology and patch diskettes (at a cost of $3 each) to users; they ended up spending $900,000 on the problem. No user testing of the driver was conducted before its release. The problem could have been identified and corrected at a fraction of the cost if the product had been subjected to even the simplest of usability testing.” wrote the researcher.” (Bias & Mayhew, 1994) “At Microsoft several years ago, Word for Windows’s print merge feature was generating a lot of lengthy (average = 45 minutes) support calls. As a result of usability testing and other techniques, the UI for the feature was adjusted. In the next release, support calls ‘dropped dramatically’; Microsoft recognized ‘significant cost savings.” (Bias & Mayhew, 1994) 9. Improve Productivity “With its origins in human factors, usability engineering has had considerable success improving productivity in IT organizations. For instance, a major computer company spent $20,700 on usability work to improve the sign-on procedure in a system used by several thousand people. The resulting productivity improvement saved the company $41,700 the first day the system was used. On a system used by over 100,000 people, for a usability outlay of $68,000, the same company recognized a benefit of $6,800,000 within the first year of the system’s implementation. This is a cost-benefit ratio of $1:$100.” (Bias & Mayhew, 1994) “In another company, business representatives did a cost-benefit analysis for a new system and estimated that a well-designed GUI front end had an Internal Rate of Return of 32%. This was realized through a 35% reduction in training, a 30% reduction in supervisory time, and improved productivity, among other things.” (Dray & Karat, 1994) “Inadequate use of usability engineering methods in software development projects have been estimated to cost the US economy about $30 billion per year in lost productivity (see Tom Landauers’ excellent book The Trouble with Computers). By my estimates, bad intranet Web design will cost $50-100 billion per year in lost employee productivity in 2001 ($50B is the conservative estimate; $100B is the median estimate; you don’t want to hear the worst-case estimate!). Bad design on the open Internet will cost a few billion more, though much of this loss may not show up in gross national products, since it will happen during users’ time away from the office.” (Nielsen, August 28, 1997) 10. Increased trust of your customers. Sites that are poorly designed are not credible or trustworthy to customers. A well-designed and user-friendly website significantly enhances customer trust. Research indicates that first impressions are 94% influenced by design, and up to 75% of users trust a visually appealing website. |
Tag: design research
Pink Frog Interactive makes the list! 41 Most Innovative Product Research Startups & Companies.

Emotions and Service Design
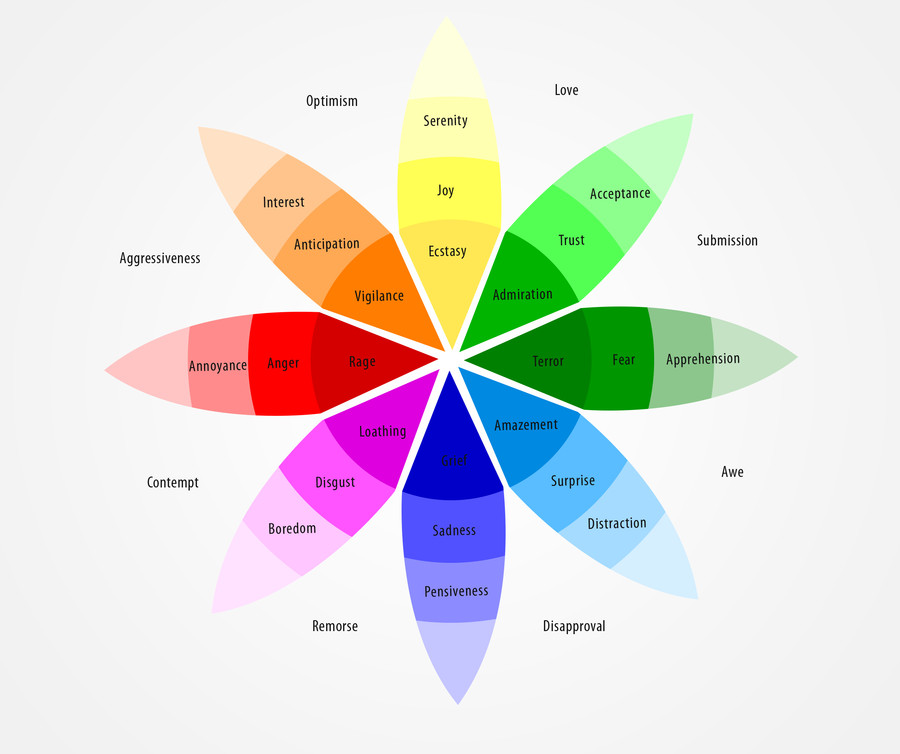
Emotions are important in design because they are a powerful motivator and can influence perception, cognition, attention, decision-making, learning, memory, social interaction, health and well-being, experience, behavior, and aid in managing information overload. Designers who learn how to assess, evoke and predict the emotional status and response of a user, can better present information in a way that aids in understanding and retaining information and communicate more effectively. They can create a better customer experience.
A partial list of design elements that can evoke an emotional response through sensory stimuli include: color, pattern and repetition, space, proportion, typography, sound, animation, motion, signs, symbols and images. In addition, designers can evoke emotions through interface design principles including, but not limited to, clear navigation, feedback, error prevention and recovery, scale and contrast, craftsmanship, structure and organization, and consistency.
Being able to assess your users’ emotional state is important. User’s who are stressed have problems memorizing and often experience tunnel vision. Repeated strikes of emotion cause it’s perceived intensity to increase. An angry customer can become furious with a couple of bad experiences. Customer experience is the number one differentiator. Companies that can provide a great experience will have loyal customers and gain trust.
Repeated strikes of emotion cause it’s perceived intensity to increase.
Other methods of evoking an emotional response include meeting expectations, allowing for play, and storytelling. In order to assess and predict the emotional response of users to a product interface or service, designers need to do research and testing to understand the environment and emotional needs of the user. They need to understand the stakeholders, ecosystem, customer journey touchpoints, and solicit domain expertise.
For example, customers using services for homelessness, foster care, school 504 disability services, veteran healthcare, etc. could have feelings of tunnel vision and stress due to their immediate situation or past experiences. Being able to navigate the services and information will depend on how well it is designed with an understanding of their emotions.
There are a variety of methods for measuring emotional response including, but not limited to, participatory design, questionnaires, experience diaries and body response measurements. Design research is needed because the way a stimulus is sensed is sometimes modified by needs, personality, experience, beliefs and attitude. In addition, a designer should be aware of how a user’s cultural background can influence their emotional response to design elements.
Learn more at https://pinkfroginteractive.com or email us at emotions@pinkfroginteractive.com